View results
Display the freeze time and the temperature distribution on the plastic and mold parts to locate regions where you can improve the cooling design and optimize the cooling time.
-
Rotate your model using the model manipulation tools to inspect the freeze time
distribution on your plastic part.
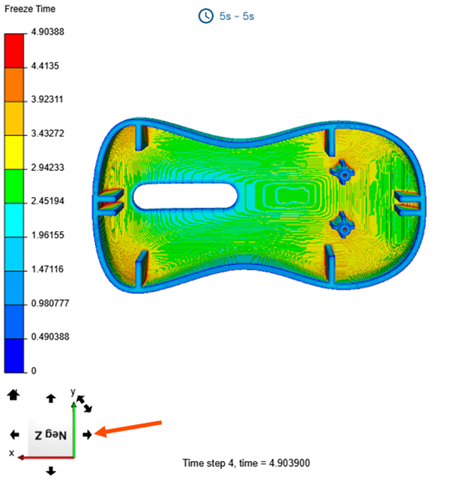 The display window shows the global and local freeze time, or safe ejection time, distribution on your plastic part in seconds.
You can use the local freeze time results to identify areas that need a longer time to cool down. This helps you optimize your plastic parts, for example, by reducing wall thickness, and improve the cooling system design by adding highly conductive inserts or baffles.
You can use the global freeze time to accurately estimate the part cost for a quote and provide a realistic cycle time target for the mold maker. Once the mold is designed, you can compare the actual mold cooling performance to the feasibility analysis of a well-designed mold.
-
Turn on the Filter toggle, then adjust the range slider
around the target cooling temperature. For example, from 110 °C to 160 °C.
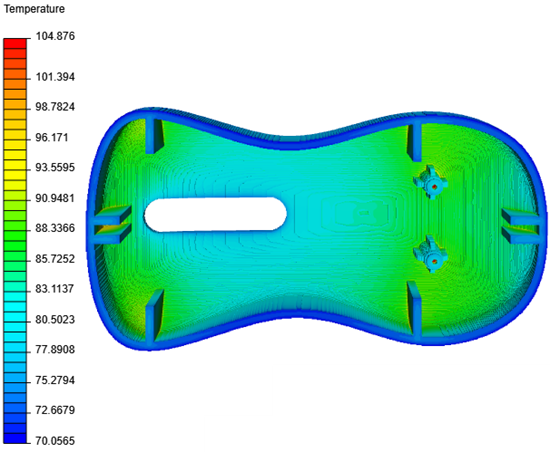 Notice the areas with relatively high temperatures. Placing cooling channels or baffles near these regions improves heat extraction, results in a more uniform temperature distribution, and reduces cooling time.
You can use basic mold analysis results to make informed decisions early in the design process, leading to significant time and resource savings.
You have completed this tutorial. You can select another tutorial from the list on the left.