View results
Display the freeze time and the temperature distribution on the plastic part and mold to locate regions where you can improve the cooling and optimize the cooling time.
-
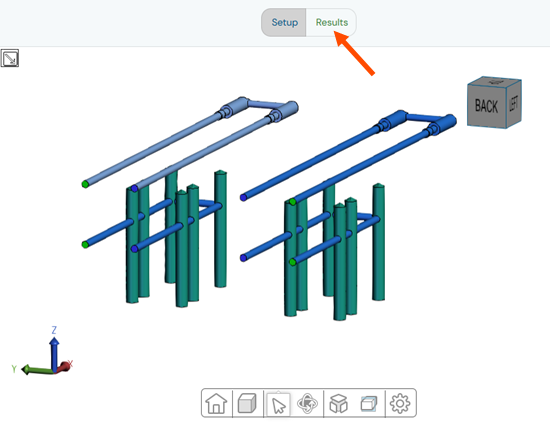
Click Results to open the results page.
-
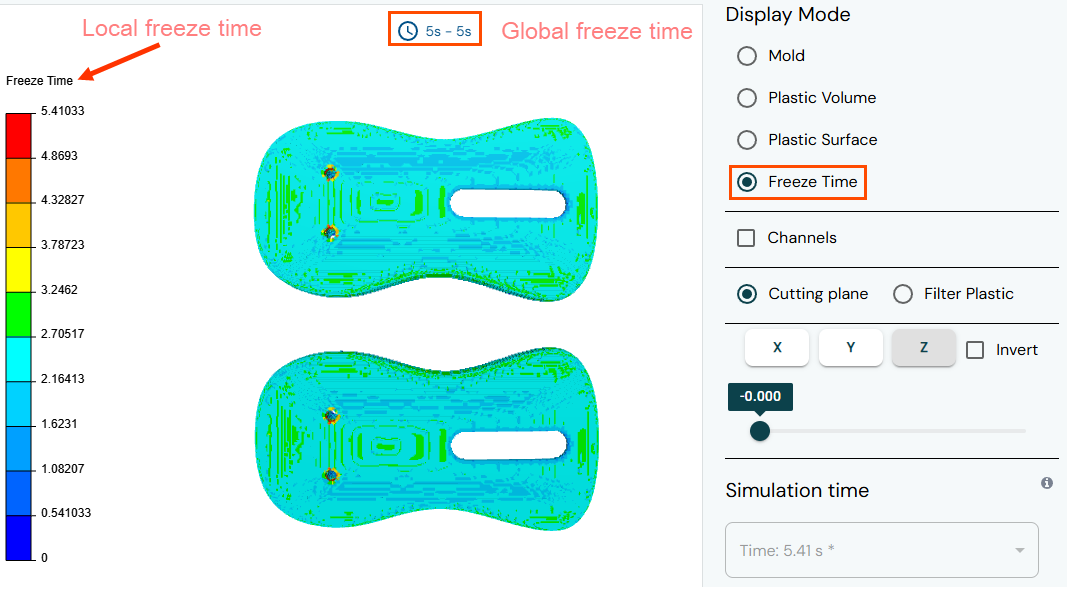
In the Results panel, from the
Type list, select Freeze
Time.
The display window shows the global and local freeze time. The freeze time, or safe ejection time, is the duration for the plastic part to develop a thick enough solidified layer, enabling safe ejection while maintaining its integrity. The local freeze time is the time, in seconds, required for 20% of the local part thickness to drop below the safe ejection temperature. The global freeze time is the time, in seconds, required for 99% to 99.5% of the plastic to reach a safe temperature for ejection.
-
In the Results panel, turn on the
Channels toggle to display the channel locations.
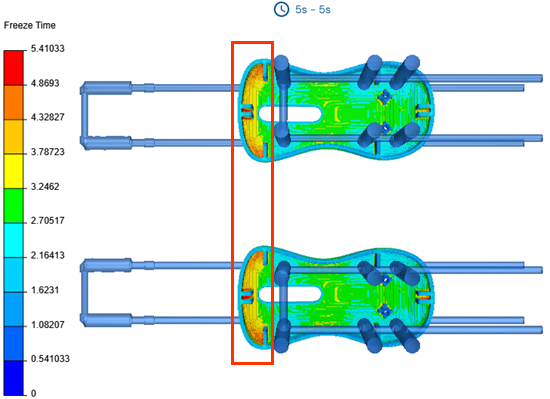 Notice that the highest freeze time regions are located at the curved sections of the mouse shell, where the cooling channels are relatively distant compared to the other side of the shell, leading to slower heat dissipation in these areas.
 -
Turn on the Filter toggle, then adjust the range slider
around the target cooling temperature. For example, from 100 °C to 105 °C.
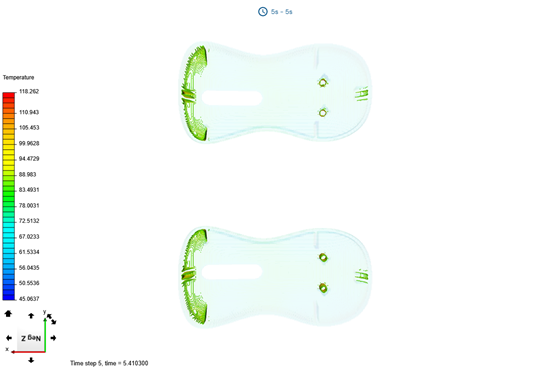 The software displays only the areas within the selected temperature range. This helps you identify regions that require longer cooling to reach the target temperature.
By analyzing the freeze time and temperature distribution, you can identify areas with inefficient cooling and adjust the cooling system accordingly. By optimizing cooling channels and ejection time, you can reduce cycle time, improve part quality, and enhance overall mold performance.
You have completed this tutorial. You can select another tutorial from the list on the left.